Every stock research tool a disciplined investor needs
Purpose-built stock research tools, one distraction-free workspace. Each is designed to answer a specific question and move you from idea to a journaled investment decision — without the clutter.
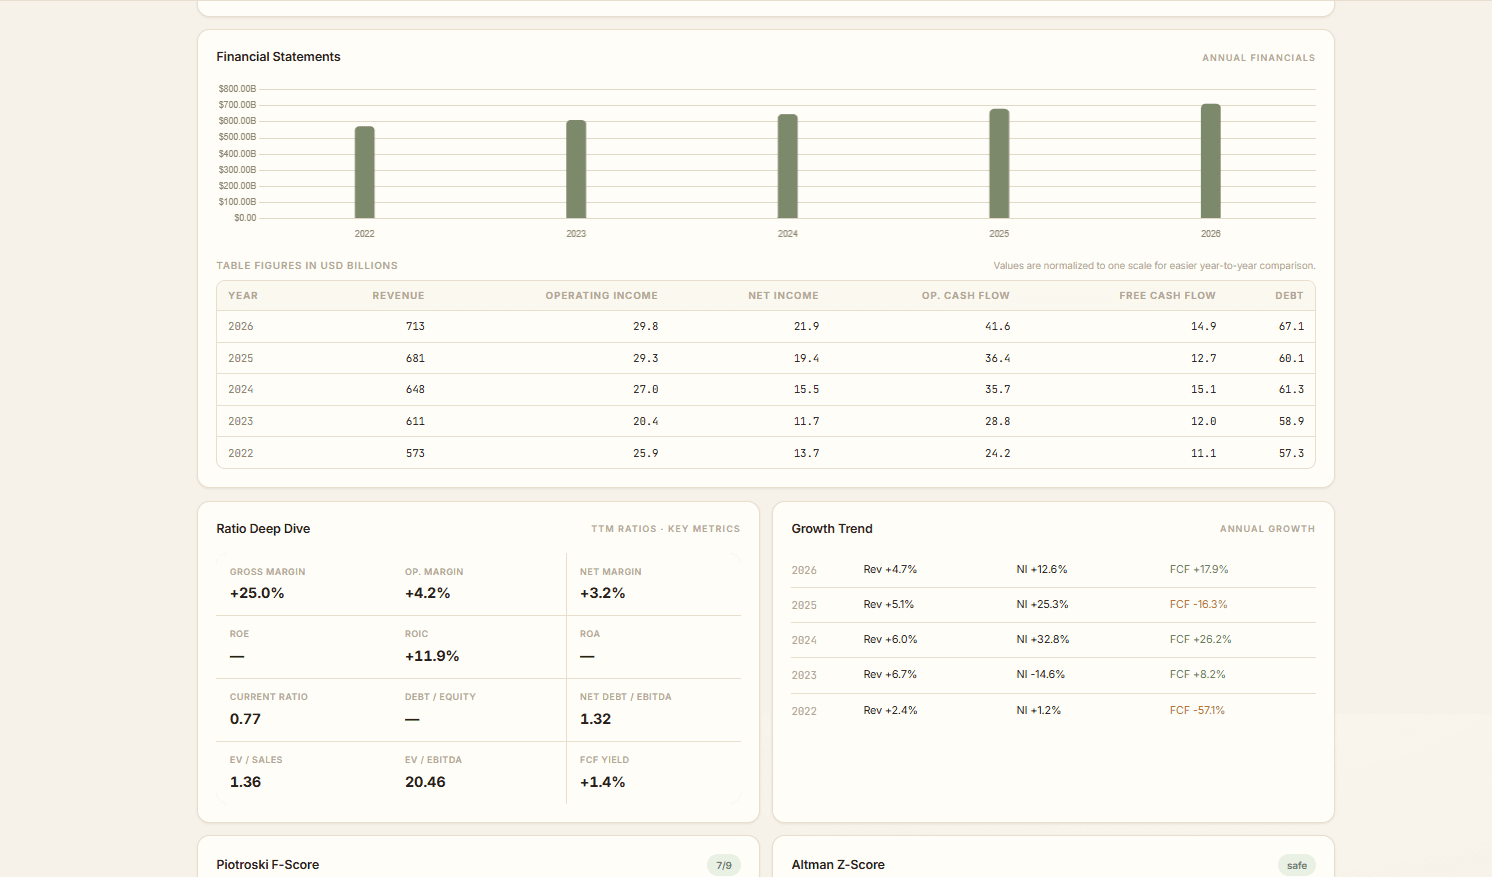
Composite scoring for consistent comparison
We normalize dozens of fundamental and technical inputs into a single, consistent score. Tunable weights mean the model reflects your philosophy — not ours.
- 0–100 composite blending fundamentals and technicals
- Piotroski F-Score on every name, broken down check by check
- Adjustable factor weights so the score matches your process
- Score-change alerts when a thesis needs another look
A screener that keeps up with your research
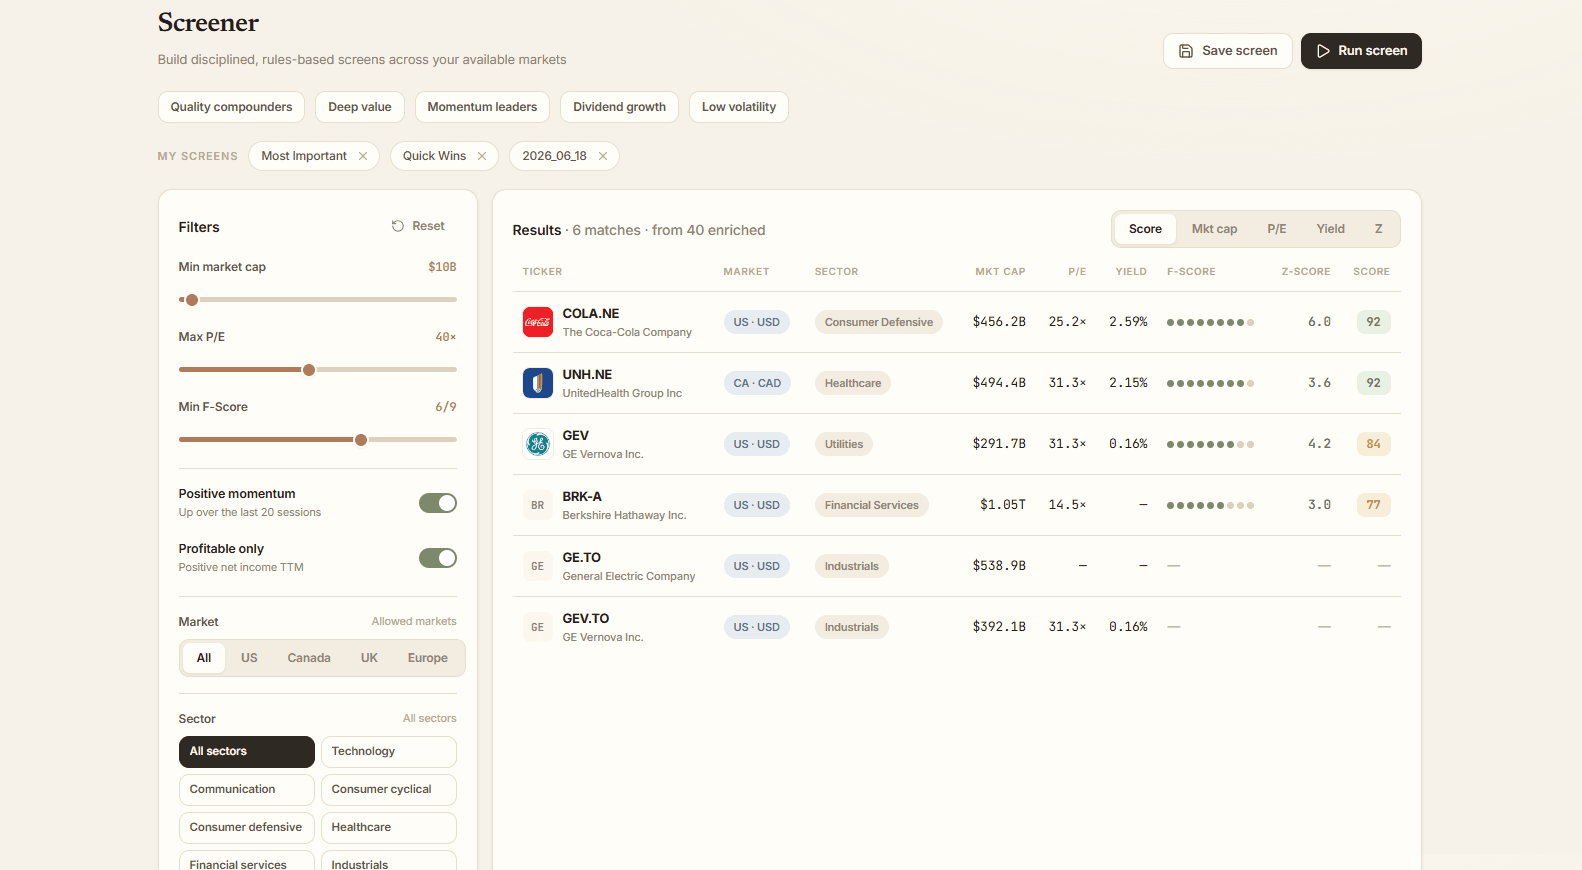
Filter the entire stock universe in milliseconds. Combine valuation, profitability, factor and F-Score filters across US, Canadian and European equities, then sort and save.
- Live filtering across US, Canadian and European equities
- Five built-in strategies: Quality Compounders, Momentum Leaders, Deep Value, Dividend Growth, Low Volatility
- Sort by score, market cap or valuation instantly
- Save screens and re-run them whenever you like
Everything about a name, on one focused page
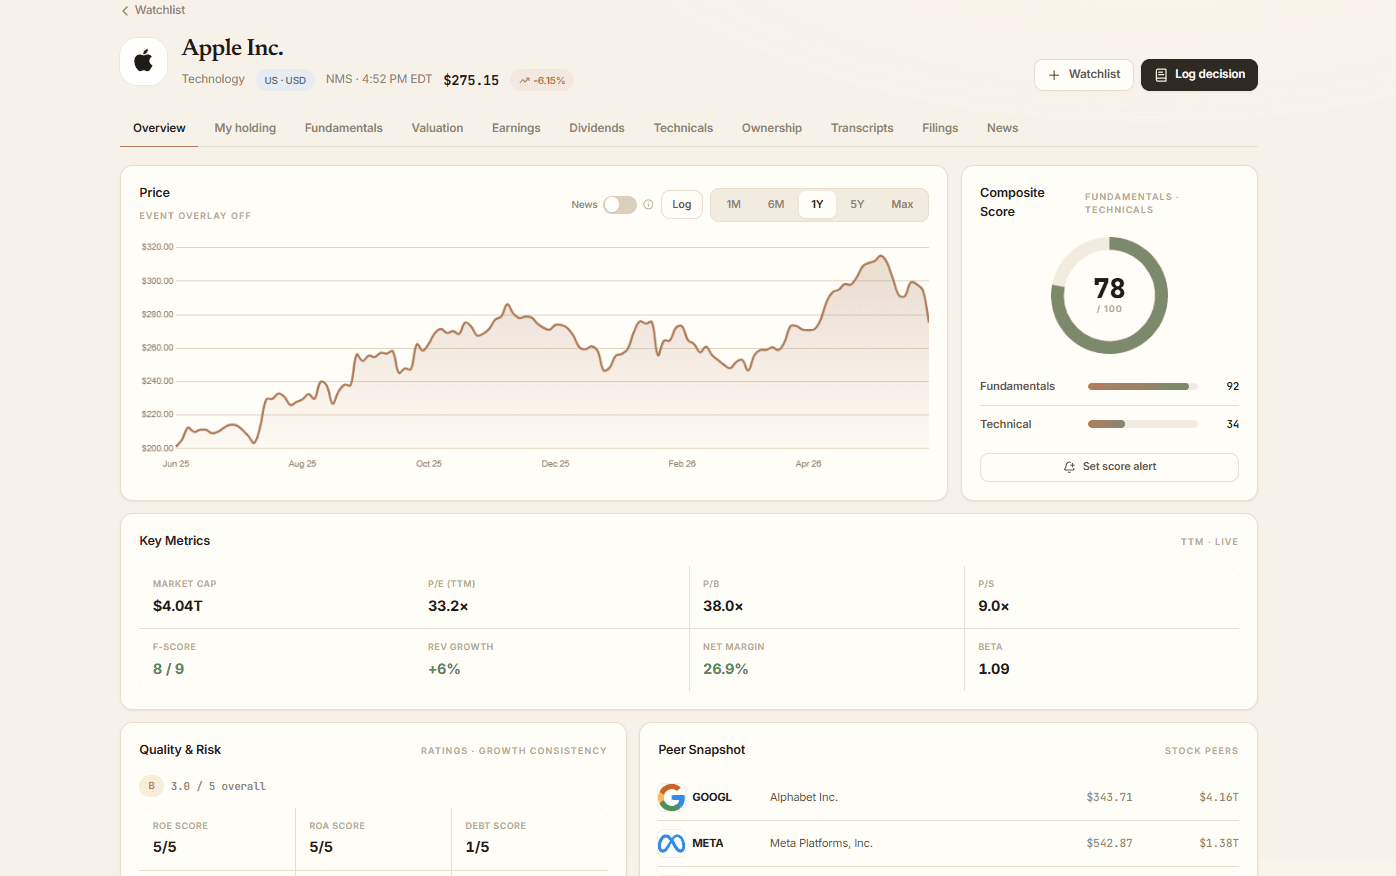
Price, fundamentals, valuation, earnings, dividends, technicals and SEC filings — organized into dedicated tabs so you find the signal without the clutter.
- Interactive price chart with news-event overlay and multiple time ranges
- Eleven dedicated tabs: Fundamentals, Valuation, Earnings, Dividends, Technicals, Ownership, Transcripts, Filings and News
- Revenue segments — product & geographic mix with a multi-year trend
- DCF valuation gauge with bull / base / bear scenarios
- Compare 2–10 stocks side by side in one sortable grid, saved as reusable baskets
- AI analysis narrative with one-click follow-up in the research copilot
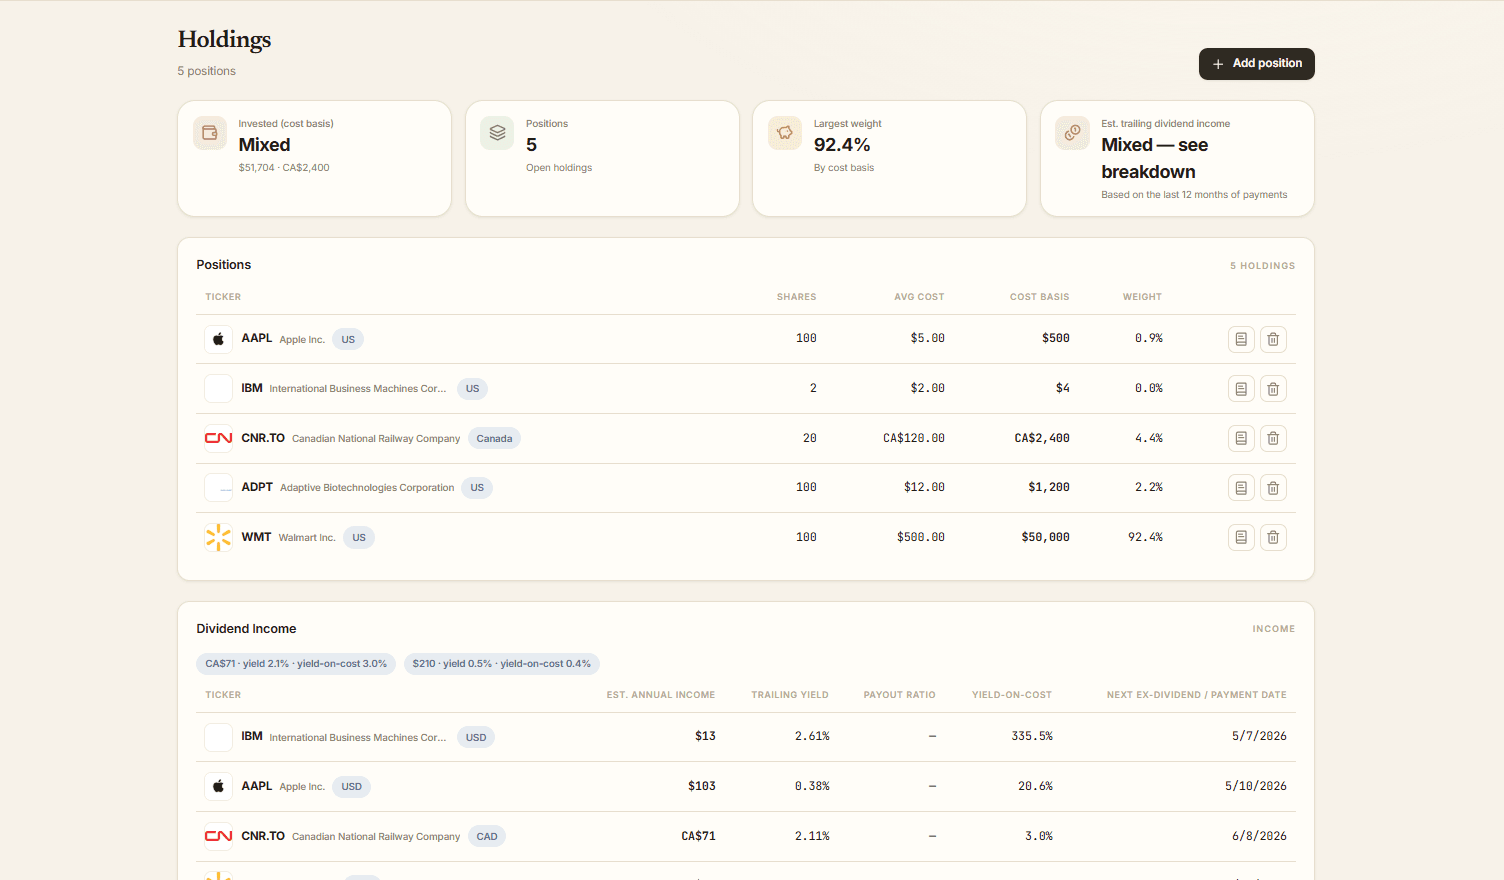
Holdings and performance, honestly tracked
See allocation, contribution and performance against a benchmark, with the detail you need and none you don't.
- Allocation by name, sector and factor
- Per-position P&L and contribution
- Benchmark-relative performance over time
- Cost basis, weights and target tracking
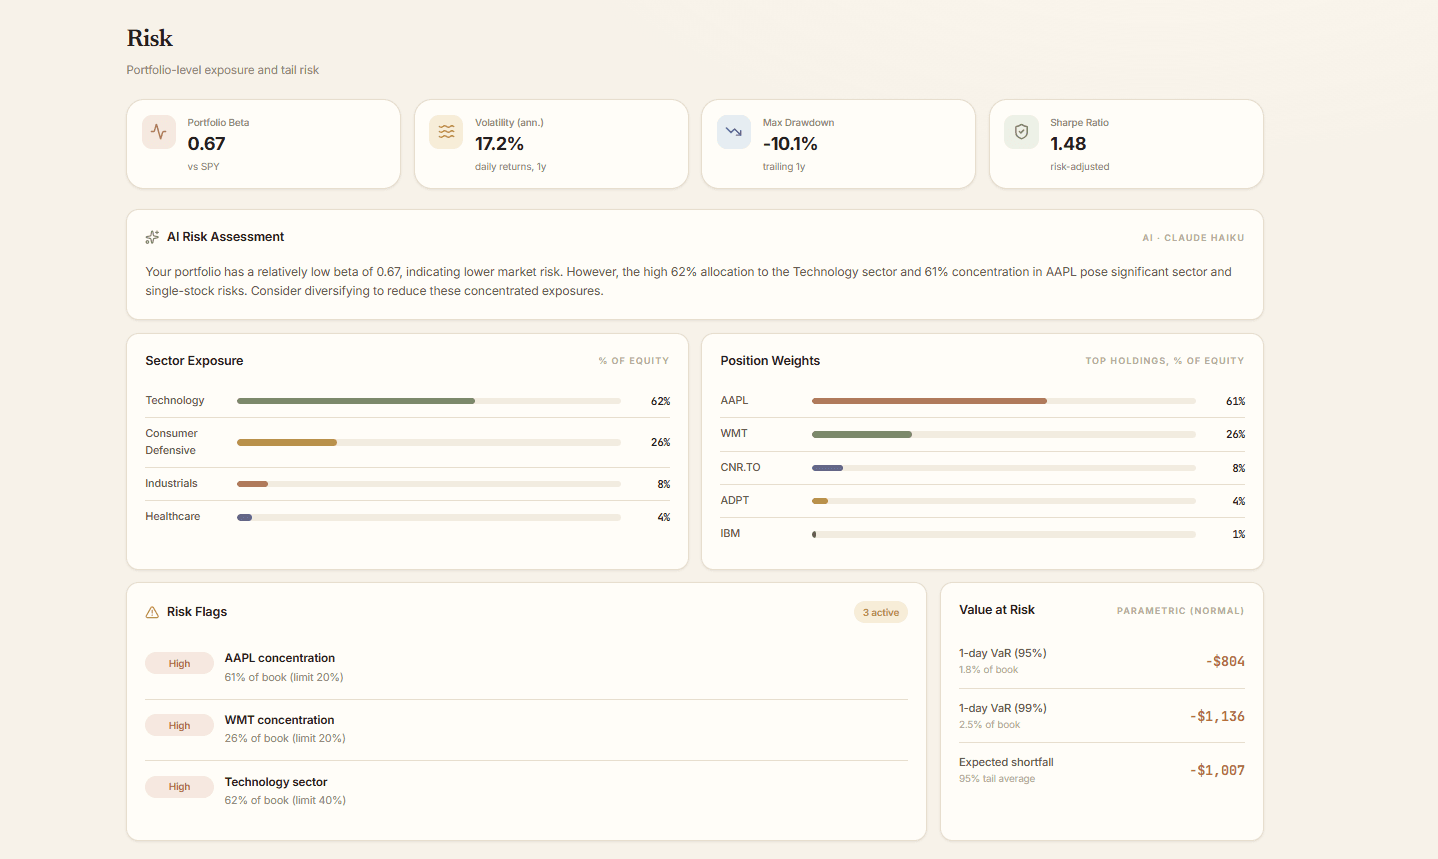
Risk surfaced before it bites
Portfolio beta, volatility, drawdown and Sharpe up top; VaR, benchmark capture, risk contribution and correlation below.
- 1-day VaR (95% & 99%) three ways — parametric, historical & Monte-Carlo — plus CVaR and tail stats (Sortino, skew, kurtosis)
- Benchmark-relative analytics vs SPY: tracking error, active return and up/down capture
- Per-holding risk contribution (marginal & component VaR, share of portfolio volatility) + a correlation heatmap
- Concentration and single-name weight flags, sector exposure and factor tilts
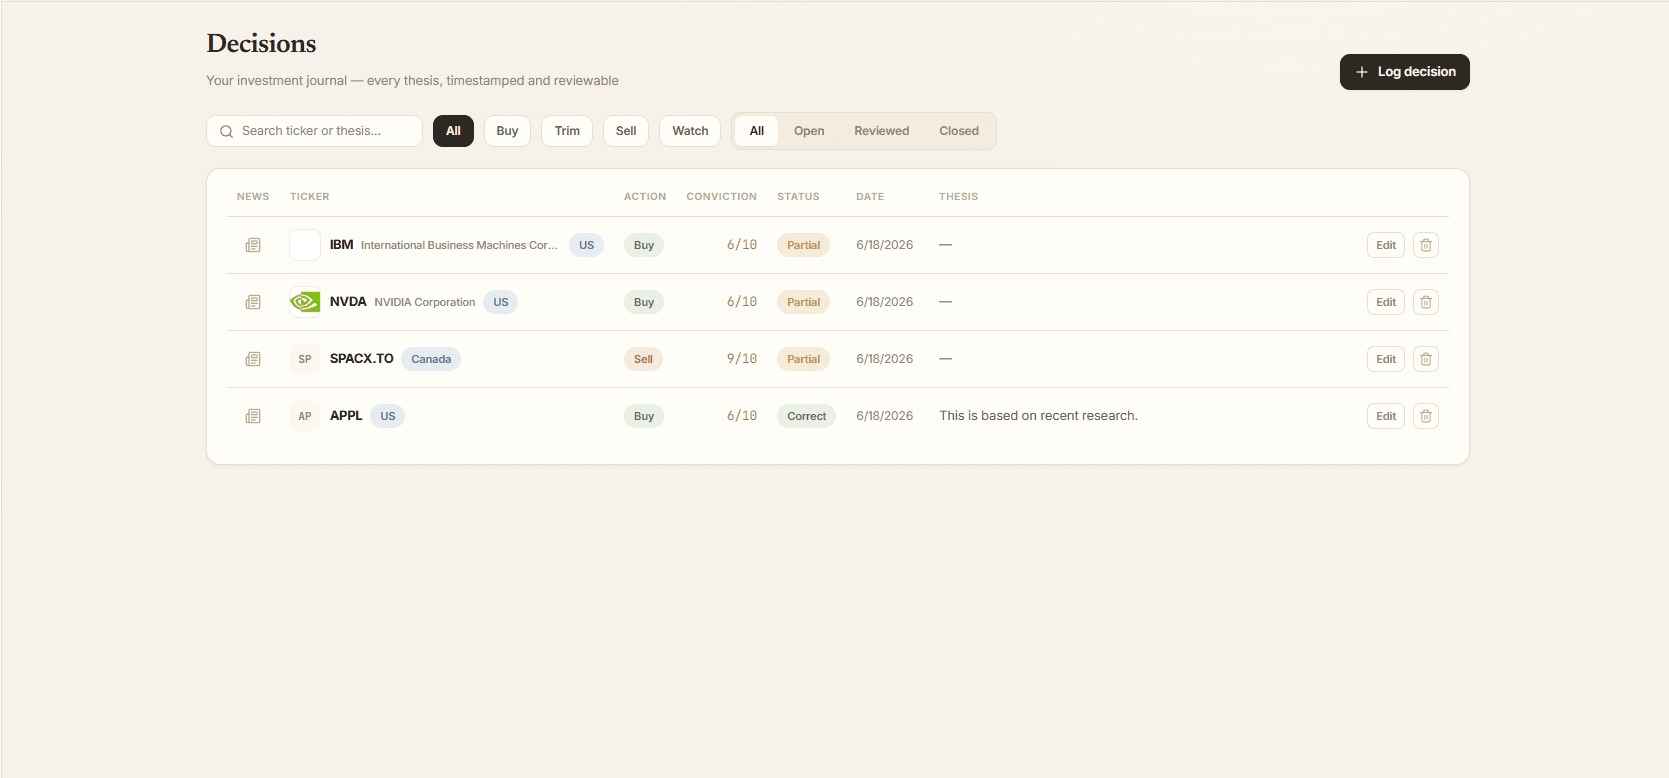
A journal that makes your process measurable
Capture each decision while it's fresh — action, conviction and thesis — then review outcomes to sharpen judgment.
- Log each decision type with a conviction score
- Attach the thesis behind every move
- Track realized and avoided outcomes
- Filter and review your full decision history
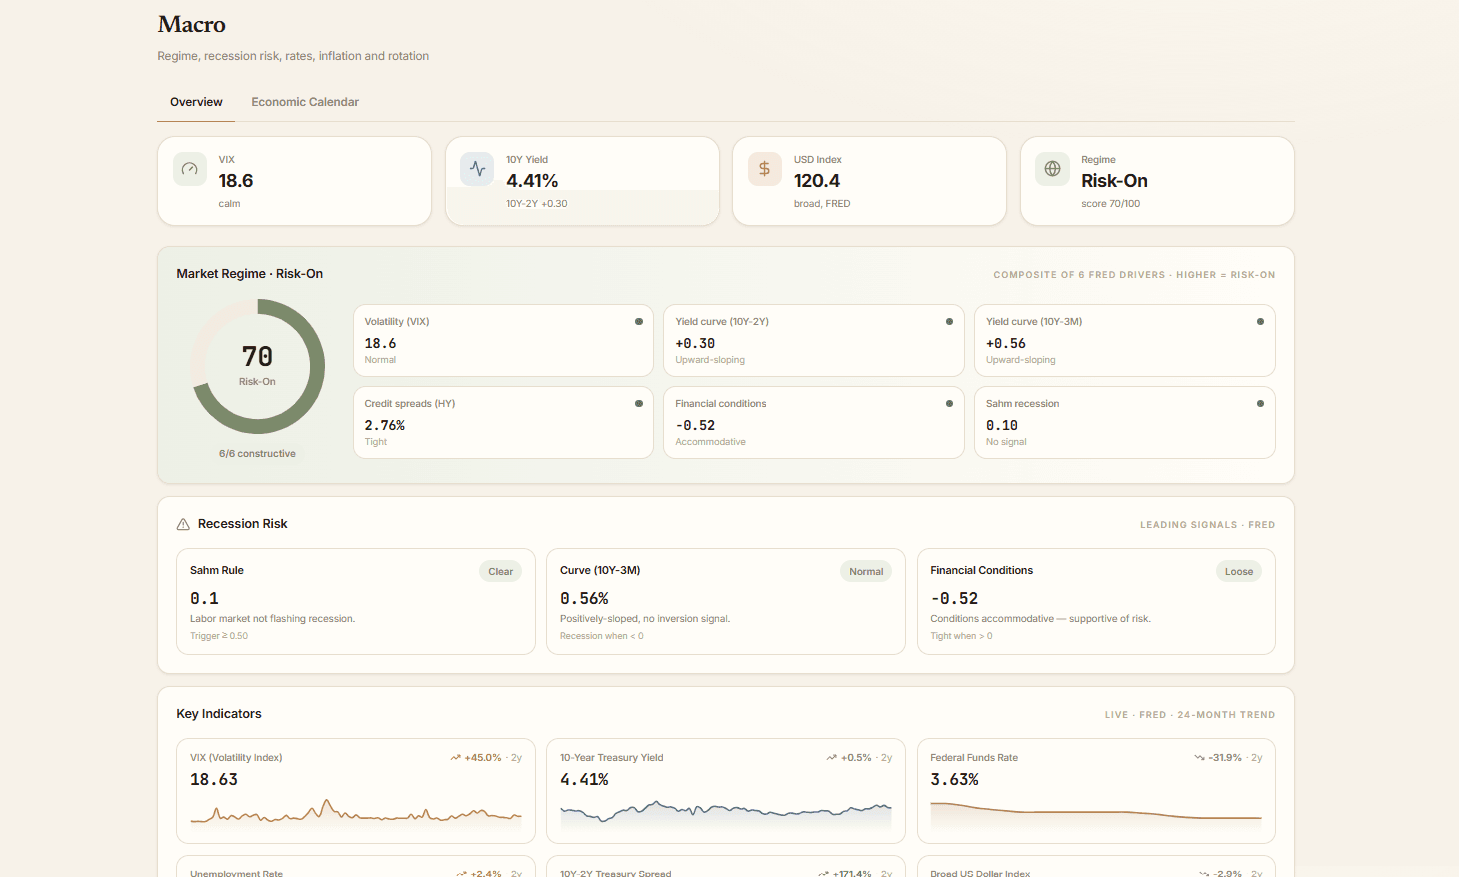
Macro that sets the scene
Regime, rates, sector rotation and real-time macroeconomic indicators — the top-down context that frames every bottom-up stock decision.
- Market-regime read with the drivers behind it
- Yield curve, VIX, dollar and breadth at a glance
- Sector relative-strength rotation
- Latest macroeconomic releases — CPI, unemployment, yield curve and more
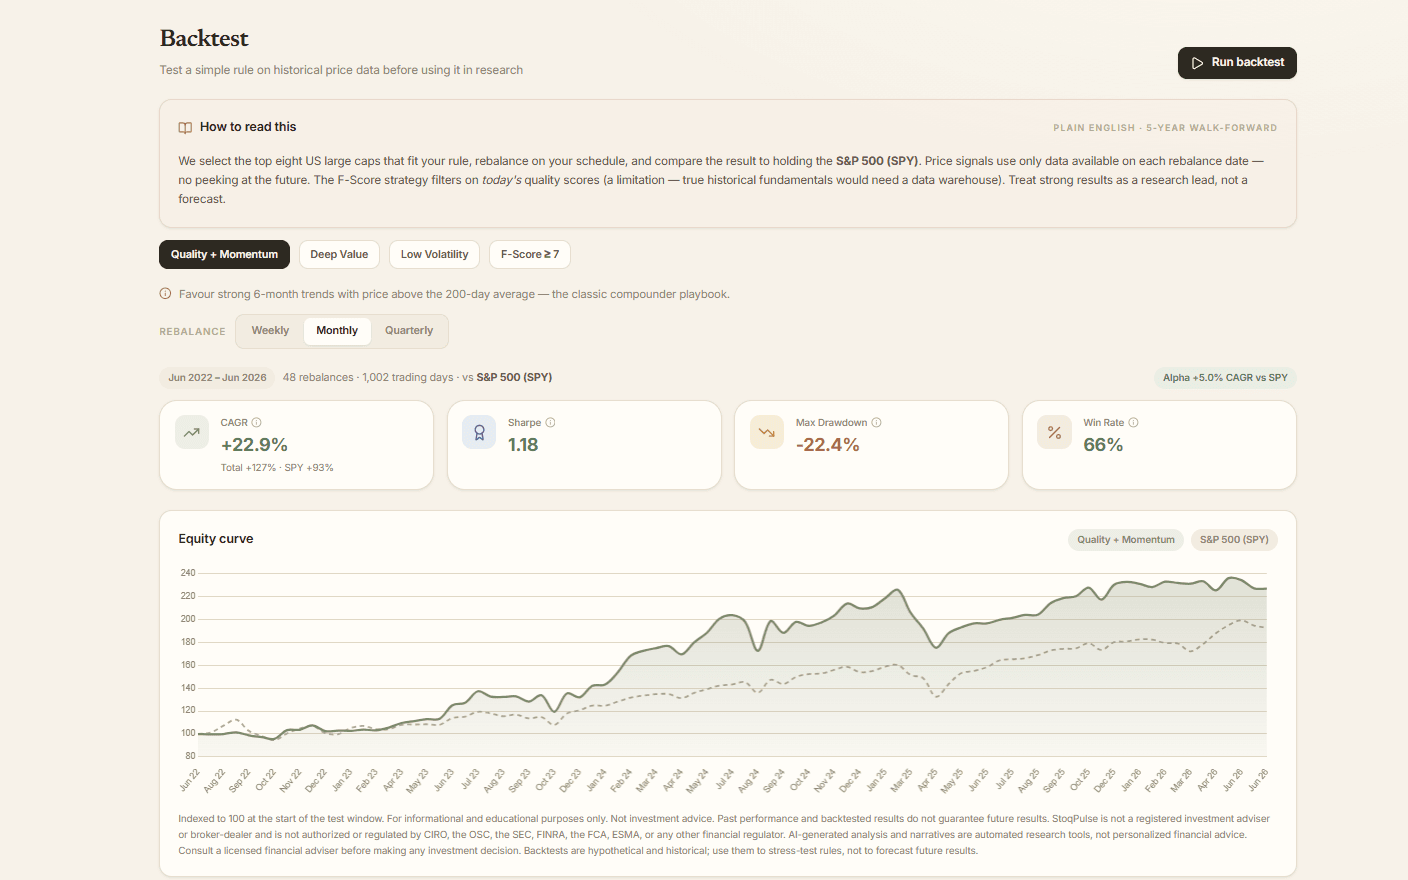
Backtest your strategy rules
Backtest rules-based strategies on a fixed set of large-cap US names over a selectable window of up to 20 years of price history (5, 10, 15, or 20 years — long enough to span full market cycles, including 2008 and March 2020). See CAGR, Sharpe, max drawdown and win rate, plus the full equity curve vs. benchmark. Results are hypothetical — past performance never guarantees future results.
- Four strategies (Quality+Momentum, Deep Value, Low Volatility, F-Score ≥ 7) with weekly, monthly or quarterly rebalancing
- Equity curve vs. benchmark
- CAGR, Sharpe, max drawdown and win-rate metrics
- Monthly return breakdown
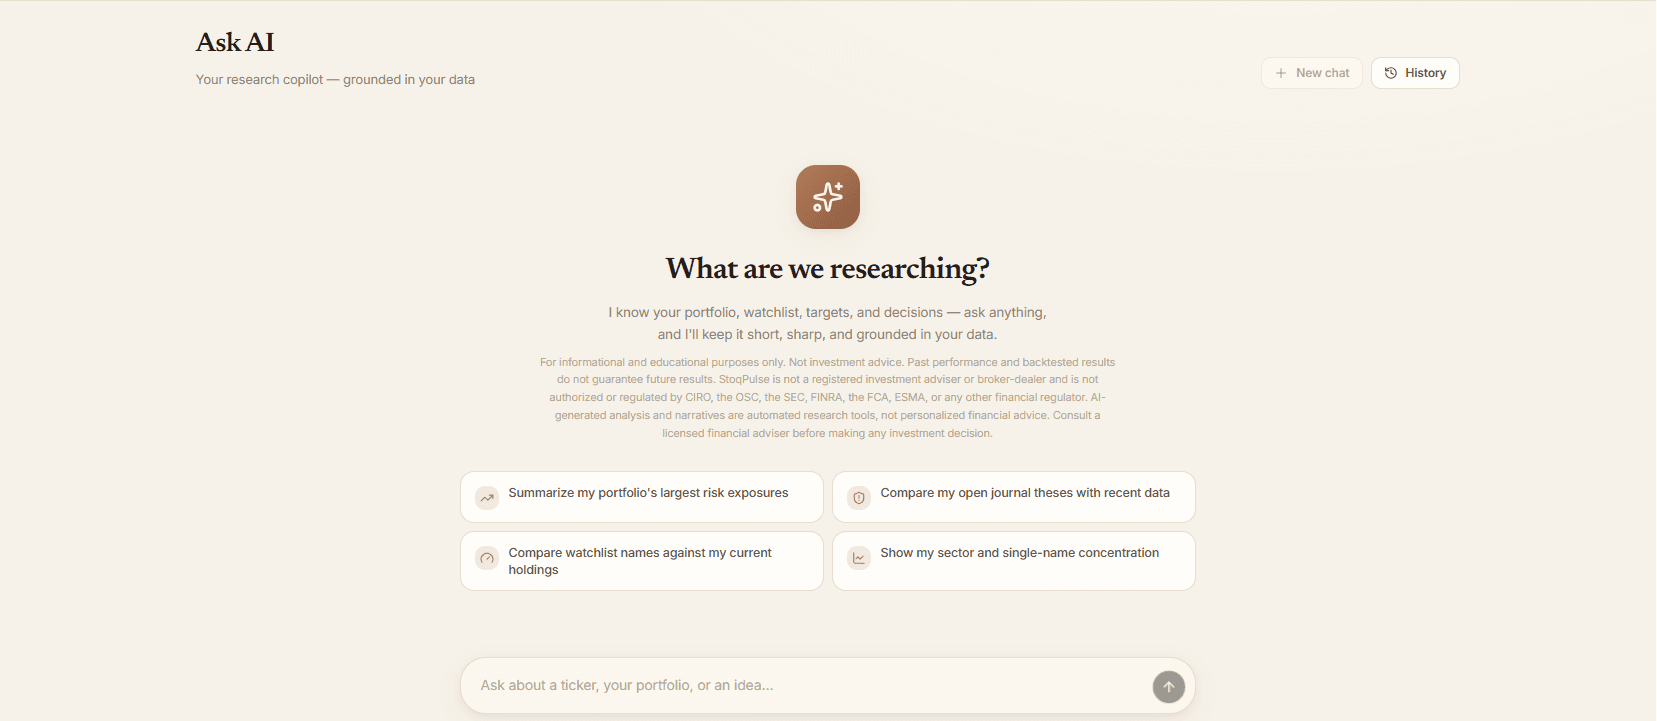
Ask AI, grounded in your data
An AI stock research copilot that answers questions about any ticker, your portfolio or a theme — and cites the underlying data.
- Natural-language Q&A on names and holdings
- Compares factors across companies on request
- Surfaces ideas from your own screens
- Cited answers you can verify, not hallucinate
Education that compounds
Short, practical lessons on the exact concepts you use in the app — from the F-Score to position sizing.
- Bite-sized lessons by level and category
- Fundamentals, valuation, risk and psychology tracks
- Progress tracking across the library
- Concepts that map directly to product features

Explore every stock research tool
Jump straight to the tool you need — each has its own in-depth guide.
Start researching your stocks in under 2 minutes
Add a few tickers and watch the whole stock research workspace come alive — free for 14 days, no card required.